Research Article | | Peer-Reviewed

Evaluation and Selection of Recently Released Hybrid Maize Varieties for Their Adaptability in West Hararghe Zone, Eastern Ethiopia

Received: 12 July 2025     Accepted: 28 July 2025     Published: 8 September 2025
Views:       Downloads:
Abstract

Maize is the most frequently widely grown crop in the world; one of the major constraints affecting maize production and productivity is the inadequacy of widely adapted, high-yielding, disease- and insect-resistant varieties. The objective of this study was to select widely adapted, stable, high yielder and good agronomic traits hybrid maize varieties for the study area.. The study was conducted at Mechara, Boke, and Doba locations for two years, during 2022-2023 main cropping seasons. Seven-hybrid maize Varieties were examined in six environments under rain-fed conditions using the RCB Design with three replications. Analysis of variance revealed highly significant (p ≤ 0.001) variance due to varieties, environments, and GEI among all traits. days to silking, days to maturity, plant height, Ear height, Number of row per ear, ear length, hundred seed weight and grain yield were highly affected by environment, and varieties, while Days to silking, Number of Kernel per ear, hundred seed weight, Ear length and Grain Yield were mainly affected by GEI variations. AMMI analysis indicated significant genotype, environment and GEI effects; accounting for 6.8%, 47.7% and 8.6%, respectively, to the total variation. IPCA1 and IPCA2 accounted for 84.3% (63.2% and 21.1%) of the G + GE variation for grain yield of the varieties evaluated at six environments. Among testing sites, Three Varieties (BH549, Damote and DK-77) were superior and stable across test environments for grain yield and related traits. Overall, based on mean grain yield, AMMI and GGE biplot, BH549 was the most stable and high-yielding hybrid maize variety.. It can be concluded that this superior hybrid maize variety can be demonstrated and popularized, as well as being important for inclusion in further breeding programs since they may contribute favorable alleles in the synthesis of new varieties and make a great contribution to the food security of the target areas.

Published in Journal of Plant Sciences (Volume 13, Issue 5)
DOI 10.11648/j.jps.20251305.11
Page(s) 180-192
Creative Commons

This is an Open Access article, distributed under the terms of the Creative Commons Attribution 4.0 International License (http://creativecommons.org/licenses/by/4.0/), which permits unrestricted use, distribution and reproduction in any medium or format, provided the original work is properly cited.

Copyright

Copyright © The Author(s), 2025. Published by Science Publishing Group

Keywords

Maize, Hybrid, Genotypic Variation, Agronomic Traits, Grain Yield, GEI, AMMI, GGE

1. Introduction
Wheat, maize and rice are the world’s leading staple cereals, each cultivated on some 200 million (M) ha (rounded). Maize (Zea mays L., also commonly known as corn) was domesticated more than 9,000 years ago in southern Mexico/Meso America , following the earlier domestication some 10,000 years ago of wheat in the Fertile Crescent of the Near East and rice in the Yangtze Valley, China . Maize is One of the most adaptable developing crops, it has a wide range of uses. Due to its maximum genetic production potential, maize is referred to as the “queen of cereals” internationally. The only food cereal crop that can be cultivated in a variety of climates, ecosystems, and environments is maize . Other varieties of maize include regular yellow/white grain, sweet corn, baby corn, popcorn, waxy corn, high-amylase corn, high-oil corn, and quality protein maize, among others . Maize is used for livestock feed and human consumption and a raw material for several industrial products . In addition, maize is a significant industrial raw material that offers significant potential for value addition .
Maize is the cheapest source of cereal calories . Maize has been used extensively for human and animal consumption in addition to its widespread use as raw material for industrial products . Maize is a dietary staple food for more than 200 million people providing an estimated 15% of the world’s protein and 20% calories . Three fourth of the grain produced is consumed at household level, 16% is used for generating cash and small proportion of the remaining is used for livestock feed and seed . The stalk and stover of harvested maize plant is also used as feed, fuel, and construction material. In addition to this maize is an important source of income and means of employment for tens of millions of farming and business communities . This number can be expected to grow as the world’s population approaches 8 billion by 2025 , indicating maize’s status as an important crop in the context of global nutrition.
Currently, maize is grown in 170 different nations. Around 193 million hectares of maize are grown globally, and 1147.7 million metric tonnes are produced globally . Maize in Africa is grown by small - and medium-scale farmers who cultivate 10 ha or less under extremely low-input systems with average maize yields at 2.2 ton/ha . The productivity of maize in Africa (2.2 ton/ha) is less than the global average which is currently 6 ton/ha . South Africa leads the African continent’s maize production followed by Nigeria and Ethiopia, respectively . Use of improved cultivars and management practices help to increase maize productivity and reduce imports in Africa . In Ethiopia, Maize is largely produced in the western, central, southern, and eastern parts of the country. Its total annual production and productivity exceed all other cereals and are second only to tef (Eragrostistef) in area coverage . It ranks first in total production (>10.5 milion tons) and grain yield (4 t/ha), and second in area coverage (> 2.5 million hectares) among all the cereals . In terms of regional distribution, 57% of the producers are found in Oromia, 23% in Amhara 13% in SNNP regional states . Ethiopia is a significant maize producer in Africa. The maize sector in Ethiopia has experienced a significant transformation over the past two decades. Important factors for the increased productivity include Increased availability and use of modern inputs (e.g. improved hybrid seeds and inorganic fertilizers), better extension services and increasing demand . Despite the recent progress, maize national average grain yield in Ethiopia is still very low relative to the potential of the crop and world’s average due to lack of well-adapted and improved cultivars and due to genotype by environment (GE) interaction . The national average yield of maize is higher than Africa’s average (2.21 t/ ha), the figure is lower than the world’s average yield (6 t/ha) . However, the national average yield of 4 tons ha-1 is still far below the world average of 6 tons ha-1.
Maize in Ethiopia is cultivated in wide range of environments. The optimized use of adapted and exotic germplasm in various production environments is a key to the continued success in increasing grain yield and other trait-specific products. However, the changing environmental conditions affect the performance of maize genotypes which requires a breeding programme that needs to consider the consequences of genotype by environment interaction in the selection and adapted improved maize genotypes. One of the major constraints affecting maize production and productivity is the inadequacy of widely adapted, high-yielding, disease- and insect-resistant varieties. In addition, the weather conditions‘ varying between seasons and locations within these agro-ecologies is another limitation. Such factors associated with the low level of crop management practices, the increasingly dwindling soil fertility situation, the incidence of erratic rainfall, diseases and insect pests, and the escalation of climatic changes are growing concerns for maize production in Ethiopia .
Despite such circumstances, the potential of maize productivity in the West hararghe zone is not yet exploited and is unable to play a role in ensuring food security for the zones. The low yield in this area is mainly due to not only a lack of improved varieties but also to the improper environment for the variety. Testing different newly released varieties in Ethiopia for their environmental reactions is crucial to avoid the risks of various environmental effects. Hence, it is important to test maize varieties for their adaptation to those areas where limited access to these newly released maize varieties is a challenging factor for the production and productivity of smallholder farmers in West hararghe zones. Therefore, this study was initiated with the objective of selectimg widely adapted, stable, high yielder and good agronomic traits hybrid maize varieties for the study area.
2. Materials and Methods
2.1. Descriptions of the Study Area
The experiment was conducted at three environments namely: Mechara, Boke and Doba during 2022-23 growing season. These environments are different in soil type, altitude, and rainfall. The detailed agro-ecological features of the testing environments are indicated below in Table 1.
Table 1. Profile of the study area.

Environments

Altitude (m.a.s.l)

Rainfall (mm)

Average temperature °C

Latitude (°North)

Longitude (°East)

Max

Min

Mechara

1796

963

15

28

40.19

08.35

Boke

1882

1213

14

28

40.64

8.73

Doba

1800

995

11

27

41.10

9.20

2.2. Experimental Plant Materials
The experimental consists seven hybrid maize varieties were obtained from Bako national Maize Agricultural Research center, Melkasa Agricultural research center, Haramaya University, MacoBu Enterprise PLC and Dupont pioneer Hi-Bred PLC. The list of the experimental varieties and their descriptions are presented in Table 2 below.
Table 2. The list and description of Hybrid Maize Varieties used for the study.

Code

Varieties

Source

Environment

G1

Bate

HU

E1= Boke 2022

G2

Shone

Dupont pioneer Hi-Bred PLC

E2=Boke 2023

G3

Damote

Dupont pioneer Hi-Bred PLC

E3= Doba 2022

G4

Kortu

Dupont pioneer Hi-Bred PLC

E4=Doba 2023

G5

DK-77

MacoBu Enterprise PLC

E5= Mechara 2022

G6

BH549

BNMARC

E6=Mechara 2023

G7

MH-138 (St.check)

MARC

Abbreviations:- BNMARC: Bako National MaizeAgricultural Research Center; MARC: Melkasa Agricultural research center; HU: Haramaya University; St.check: standard check
2.3. Experimental Design, Layout and Management
The experiment was set up using a Randomized Complete Block design (RCBD) with three replications. Each experimental plot measured 22.5m2 (4.5 m × 5m) and had six rows that were 75cm x 35cm between rows and plants apart. Distances between blocks and between plots were 1 and 0.75 m, respectively. Within each replication, the varieties were distributed randomly to plots.. Seed rate of 25 kg ha-1 and Fertilizer rate of 150 kg ha-1 NPSB was applied at planting. Urea applied at the rate of 150 kg ha-1. Urea (N) application was on split basis; half at planting and the remaining half at tillering stage. All additional crop management practices and recommendations were uniformly implemented to all varieties as previously recommended for the maize crop.
2.4. Data Collected
Data were collected from ten plants in four rows of each plot and randomly tagged, and the relevant data was recorded. The following are the major parameters recorded: Days to 50% emergence (days), days to tasseling (days), days to silking (days), days to 75% physiological maturity (days), Plant height (cm), ear height (cm), ear length (cm), number of rows per ear, number of kernels per row, hundred seed weight, and grain yield (kg ha-1).
2.5. Statistical Analysis
Various statistical software applications were utilized to analyze the data. In accordance with the usual technique recommended by , the analysis of variance for each location and the combined data over location were carried out using a mixed linear model to evaluate the differences among genotypes in their performance for yield and yield-associated traits. Analysis of variance (ANOVA) of the individual location as well as pooled data over locations, AMMI, and GGE biplot analysis were performed using R statistical software). The least significant difference (LSD) test was used to compare genotype means. For GGE biplots GEA-R (Genotypic × Environment Analysis with R Widows) Version 4.2.2 was utilized.
3. Results and Discussions
3.1. Pooled Analysis of Variance
The combined analysis of variance (Table 3) revealed that, there were very highly significant differences (p<0.001) among Locations, variety and their interactions. The variances due to location was highly significant for days to silking, days to maturity, plant height, Ear height, Number of row per ear, ear length, hundrend seed weight and grain yield, indicating the distinct and differential effects of different environmental conditions. The variances due to Varieties were highly significant for days to silking, plant height, ear height, Number of kernel per row, number of row per ear, ear length, hundred seed weight and grain yield indicated the genetic differences of the genotypes in the environments. This significance difference indicates the presence of variability in genotypes as well as diversity of growing conditions at different locations and reflects the differential response of genotypes in various environments.
Table 3. Combined analysis of variance for different phenological, yield and yield related parameters of 7 hybrid maize varieties tested over three locations.

Source of Variation

DT

DS

DM

PH

EH

NRPE

NKPR

EL

HSW

GY

Variety

30.7ns

25**

119ns

2352**

1670**

6.5**

43.5**

41.4**

145**

3379602**

Location

15.7ns

46.2**

813**

6524**

6826**

4.8**

0.8ns

1812**

621**

19856525**

Replication

53.5*

8.3ns

220ns

196ns

105ns

0.2ns

0.4ns

1.5ns

1.18ns

389610ns

Year

1447**

753**

2366**

2753**

5784**

1.8ns

18.4ns

406**

447**

9724517**

Var *Loc

19.7ns

5ns

209ns

379ns

253ns

0.8ns

7.1ns

2.73ns

6.3ns

1077838ns

Var*year

28.5ns

8.2ns

245ns

77ns

162ns

0.96ns

5.8ns

6.97ns

7.6ns

1173423ns

Loc*year

1465**

1409**

1957**

2578**

3194**

0.3ns

102**

325**

502**

46153050**

Var*Loc*year

13.6ns

11.8*

109ns

205ns

167ns

0.54*

5.97*

2.5**

7.3*

475678*

Residuals

14.22

5.53

131.73

311.8

135.3

0.65

5.47

3.71

7.54

1023468

3.2. Varietal Evaluation
3.2.1. Grain Yield (kg ha-1)
The ANOVA result presented in Table 3 indicated notable variations between the studied varieties on grain yield. The seven hybrid maize varieties mean grain production performances in each of the six environments are shown in Table 4. The varieties mean grain yields varied across all environments, with MH-138 at E4 (Doba-2023) having the lowest mean yield of 3339.3kg ha-1 and BH549 at E3 (Doba-2022) having the highest mean yield of 8832.5kg ha-1. BH549 and Damote was the highest yielding and most consistent variety out of those that were examined. The variation might be due to the change in the genetic background of these varieties and their response to environmental conditions . Similarly, the photosynthetic ability of different varieties to utilize maximum light energy, maximum assimilate production, and its conversion to starch could alter the grain yield .
3.2.2. Hundred Seed Weight (Gram)
One major yield factor that makes a big difference in the final grain yield of the maize crop is the hundred-seed weight. Table 5 presents information on the weight of one hundred seeds as influenced by various types. Based on statistical analysis result, there was a substantial variation (P < 0.01) in the one-hundred seed weight among the tested varieties. Variety Damote had the highest seed weight (37 gram), followed by Shone and BH549 recorded 36.4gram and 35gram respectively. The Bate variety has the lowest reported weight (30gram) for 100 seeds (Table 5). The fluctuation in one-hundred seed weight among different varieties might be due to a change in the size of the grains . This might also be due to the change in the time period of the grain filling stage, which alters the final grain weight of maize varieties . The change in the genetic capability of different varieties for nutrient uptake might also be one of the reasons for a change in one-hundredth seed weight. also found significant changes regarding one-hundredth seed weight in different tested varieties of maize.
3.2.3. Number of Kernels Per Row
Table 5 shows the number of kernels per row as affected by different maize varieties. Statistical analysis of the data shows significant variation for the number of kernels per row among tested varities (P < 0.01). The maximum number (41.4 kernels per row) were produced by variety BH549, followed by varieties Shone, DK-77, and Damote, which produced 40, 39, and 38.9 kernels per row respectively. Whereas, varieties Kortu and MH-138 produced the lowest number of kernels per row (36.5) and (37.5) kernels per row. The result was in line with , who also found significant variation in kernel number per row for different maize genotypes.
3.2.4. Number of Rows Per Ear
Number of rows highly significantly (P < 0.01) affected by different maize varieties. More rows per ear were recorded by variety BH-549 (16 row per ear), followed by shone (15.4 rows per ear), which was statistically similar to bate (15.3 rows per ear) and MH-138 maize variety recorded (15.2 rows per ear). Likewise, the number of rows per ear in the varieties Kortu and DK-77 was (15.1 and 15 row per ear) respectively. The minimum rows per ear, were found in variety Damote (14 row per ear) (Table 5). Similarly, the findings of also reported significant variations in the number of row per ear for different maize genotypes.
3.2.5. Ear Length (cm)
The main effect of location, variety and GEI has a significantly (P < 0.01) affect maize ear length. The longest ear length was recorded from BH549 (19.2 cm), followed by MH-138 (19cm) and DK-77 (18.6cm). The shortest Ear length was recorded by Damote (17.7cm) and Bate (17.5 cm) (Table 5). In constrast to this results, reported a significant effect of the environment on maize varieties and no significant effect of G x E interaction.
3.2.6. Ear Height (cm)
Data concerning ear height is shown in the Table 5. The Combined analysis of variance indicated that the ear height was significantly affected by varieties (P <0.01) (Table 3). Higher ear height (122.3cm) was documented for BH549, which was not statistically at par with variety shone (113.1cm), followed by kortu (111.6cm). The lowest ear height (93cm) was recorded for variety MH-138. The possible reason for differences in ear height among different tested genotypes might be the differences in their genetic makeup .
3.2.7. Plant Height (cm)
Pant height is a crucial characteristic for grain yield as well as for varietal development. There was a significant difference (P<0.01) in the combined mean effect of plant height within variety and location (Table 3). In general, MH-138 recorded the lowest plant height (200.6cm) and Shone variety recorded the highest (239.2cm) plant height (Table 5). The variations in the maize varieties for plant height is most probably due to the genetic variation, Similarly, environmental factors are also closely linked with the change in plant height . Plant height was also genetically linked with the reproductive stage; whenever the plant is shifted to the reproductive stage, it stops its inter-node formation. This fact indicated that maize varieties, which are early in their maturity, would have shorter plant heights .
3.2.8. Days to Maturity
The Combined analysis of variance indicated that the days to maturity was significantly affected Within and among locations at (P < 0.01) (Table 3). A genotype's maturity is a crucial characteristic that influences economic yield either directly or indirectly. It is the most detrimental traits in variety selection in the current climate challenging condition as it helps the escaping of that crop in the scarce condition of rainfall and providing some production with minimum loss of its yield potential. A number of factors, including days to 50% tasseling, silking, brown husk maturity, etc., determine maturity itself. Previous reports indicated, the female inflorescence in ear production of maize is typically quite sensitive and unaffected by such circumstances .
3.2.9. Days to Silking
The combined analysis of variance showed wide variability (P<0.01) among the varieties for the days to Silking (Table 3). The highest days to silking (81.7 days) was recorded from BH549 late and the earliest days to silking by Kortu (78.3 days, Table 5).
3.2.10. Days to Tasseling
The combined analysis of variance of variety performance for days to tasseling within and among locations revealed a non significant difference at (P<0.05) (Table 3). Of the tested varieties of maize, Kortu (77.4 days) recorded the shortest day and Bate (85.6 days) was the late tasseling variety (Table 5).
Table 4. Mean performance of 7 hybrid maize varieties in 6 environments.

Genotype

E1

E2

E3

E4

E5

E6

Combined mean yield (kg/ha)

Bate

3602bc

4522.6

6881.9

3736.3bc

3737.5b

4873.9b

4559c

Shone

3641.1bc

4946.2

7292.6

4875.2a

4824ab

5866.5a

5241ab

Damote

4884.8a

5436.

7617.7

4510ab

5319.6a

5526ab

5549a

Kortu

3971.7a-c

4898.7

6930.6

4972.7a

5507.9a

5212.4ab

5249ab

DK-77

4494ab

4379.3

8150.8

3825bc

5064ab

5580.7ab

5249ab

BH549

4416.7a-c

4603.8

8832.5

5310.5a

5408a

5640.5ab

5702a

MH-138

3422.6c

5441.3

5637.8

3339.3c

4685ab

5157.7ab

4614bc

Mean

4061.84

4889.7

7334.8

4367

4935.14

5408.24

5166.1

CV

14.5

13.94

26.9

12.9

17.45

8.6

19.6

LSD

1050.3

1212.4

3511.95

1001.5

1532.2

823

670.84

Table 5. Combined Mean Performance of Hybrid Maize of 2022-2023 Cropping Season at Boke, Doba and Mechara.

Variety

DT

DS

MD

PH

EH

EL

NKPR

NRPE

HSW

GY

Bate

85.6b

81.3bc

146.1ab

215.3b

106.8bc

17.5a

38.8d

15.3b

30a

4559c

Shone

78.8ab

80.6bc

143.2ab

239.2c

113.1ab

18.6bc

40cd

15.4b

36.4cd

5241ab

Damote

79.1ab

80.4bc

149.2b

230.2c

106.8bc

17.7a

38.9bc

14a

37d

5549a

Kortu

77.4a

78.3a

144.4ab

232.2c

111.6b

18.2ab

36.5a

15.1b

34.6bc

5249ab

DK-77

80ab

80.4bc

145.7ab

213.6ab

98.6cd

18.6bc

39bc

15b

33.3b

5249ab

BH549

78.7ab

81.7c

140a

233c

122.3a

19.2c

41.4d

16c

35bc

5702a

MH-138

78.8ab

79.9ab

143ab

200.6a

93d

19c

37.5ab

15.2b

30.3a

4614bc

Mean

82.2

80.6

144.6

207.9

580.5

18.4

38.2

15.3

30.2

5166.1

CV

5

3.1

7.9

9.4

14.9

3.9

6.2

5.3

8

19.6

LSD

1.7

1.66

7.6

13.9

10.6

0.6

1.6

0.5

1.8

670.8

Abbreviation: GY= grain yield in kg per hectare, HSW=hundred seed weight (gram), NKPR=number of kernel per row, NRPE= number of row per ear, PH= plant height (cm), EH= ear height (cm), EL= ear length (cm), DT =days to tasseling (in days); DS=Days to silking (in days), DM=days to physiological maturity (in days)
3.3. AMMI Analysis
The AMMI model combines the traditional ANOVA and IPCA into a single analysis with both additive and multiplicative parameters . The first part of AMMI uses the normal ANOVA procedure to estimate the genotype and environmental main effects. The second part involves the IPCA of the interaction residual (the residual after the main effect is removed). In this study, the combined analysis of variance and AMMI analysis is shown in Table 6. It was observed that there are significant differences in the environment. The combined ANOVA showed that grain yield was significantly affected by the environment because of significant variance at the 1% level (Table 6), which explained 47.7% of the total variation, whereas the GEI accounted for 8.62%, and the genotypes captured 6.8% of the total sums of squares. The first interaction principal component (IPCA 1) accounted for 63.2% of the variation caused by the interaction, while IPCA 2 accounted for 21.1% of this variation. This result was in agreement with the findings of who reported that the yield potential of maize in Ethiopia is greatly influenced by environmental factors.
Table 6. ANOVA for the Additive Main effect and Multiplicative Interaction (AMMI) for grain yield of 7 hybrid maize varieties over environments.

Sources

DF

SS

Sum of square explained

MS

% Total

% G x E

% G x E cumulative

ENV

5

142000000

28348733**

47.7

REP (ENV)

12

12900000

1075788*

4.33

GEN

6

20300000

3379602**

6.8

GEN: ENV

30

25700000

856091*

8.62

IPCA 1

10

16200000

1623302*

63.2

63.2

IPCA 2

8

5410000

676046

21.1

84.3

IPCA3

6

2630000

437738

10.2

94.5

IPCA4

4

1260000

315679

4.9

99.4

IPCA5

2

152000

76097

0.6

100

Residuals

72

71800000

997140

Total

155

298000000

1923163

Key: DF=Degree of freedom, SS= Sum of squares, MS= Mean of squares, SS%= percentage of sum of squares, *= significant, **= highly significant, PC= principal components
3.4. Genotype and Genotype by Environment Interaction Biplot Analysis
3.4.1. Genotype Evaluation Based on Mean Performance and Stability
The GGE biplots in Figure 1A were built with environmentcentered data (centering = 2), not scaled (scale = 0), with column singular value partitioning (SVP = 1). An ideotype is the ideal genotype for a certain environment or cropping objective; the ideotype thus combines high mean yield and stability in a mega-environment. The "Mean vs Stability" GGE biplot (Figure 1A) allows the efficient evaluation of genotypes by both characteristics. The small green circle in Figure 1A represents the "meanenvironment", which is an environment built on the coordinate means for all environments in the analysis. The green line in (Figure 1A) with the arrow passing through the origin represents the "mean-environment axis" and the direction in which the arrows point represents higher mean yield for the genotypes. The second axis represents stability; genotypes that are closer to the origin are more stable . In terms of mean yield, the genotypes classification is BH549 > Damote > Kortu>> DK-77 > shone > grand mean > MH-138 > Bate (Figure 1A). Among the unstable varieties, Bate had the highest instability. The most stable, BH549 and Damote were among the most productive varieties. There were genotypes with high stability and yield close to the grand mean, which was the case for Kortu, DK-77 and Shone. According to Figure 1A the genotypes that are closest to the definition of ideotype for the analyzed data were BH549 and Damote, being among the most productive and highly stable.
3.4.2. Which-Won-Where Patterns
Visualization of the “which-won-where” pattern of MET data is important for studying the possible existence of different mega-environments in a region . The polygon view of a biplot is the best way to visualize the interaction patterns between genotypes and environments and to effectively interpret a biplot . There are four sectors in this polygon. The Varieties BH549, Damote, MH138 and Bate that are situated at a polygon’s corner are hence vertex genotypes with the longest vectors. Vertex genotypes within each sector indicate the genotypes with the highest yields within that sector relative to other sectors in the environment. These genotypes were among the most environment-responsive in the directions that they responded to. However, the low-yielding genotypes Bate and MH-138 were spread out among all over the test locations and showed poor yields at each site. Another important feature of Figure 1B is that it indicates environment groupings, which suggests the possible existence of mega-environments. Thus, based on biplot analysis, two mega-environments are suggested. The first individual mega-environment is the Doba location, with the BH-549 variety being the winner, and the second mega-environment contains the Mechara and Boke locations, with the variety Damote being the winner. This result is in para with the findings of several authors who reported access to delineate mega-environments using AMMI and GGE bi-plot models .
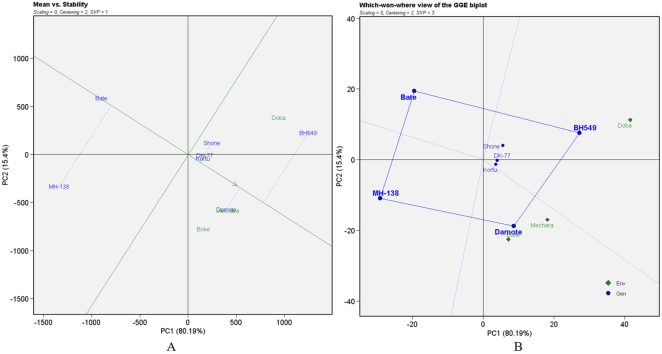
Figure 1. (A) Genotype ranking based on both average yield and stability, (B) The which-won-where view of the GGE biplot to show which Varieties performed best in which environments.
3.4.3. Discriminating Ability of the Test Environments
The plot in Figure 2A enables evaluation of the test environments, to identify environments that may serve to select superior genotypes in an efficient way for a mega-environment. The selected test environment should have high genotype discrimitiveness and representativeness. Environments with shorter vectors have less discrimitiveness in relation to genotypes, i.e., all genotypes tend to perform equally and almost no information about genotypic differences can be revealed by such environments. A short vector could also mean that PC1 and PC2 do not represent that environment very well in cases where G + GE has not been retained properly. The environments Doba presented long vectors, which means they have high discrimitiveness for the genotypes. It is also possible, by Figure 2A, to identify environments with high representativeness: the smaller is the angle between an environment and the mean-environment axis (green axis), the higher is its representativeness. based on our study, Doba was the most discriminating environment, but least representatives (Figure 2A). Based on representative nature, Mechara and Boke was representative (smaller angels with AEA) environments, but least discriminating environments. Discriminating, but not-representative environment Doba is useful for selecting specifically adapted genotypes if the target environment can be divided into mega-environment .
3.4.4. Evaluation of Environments Relative to the Ideal Environments
An ideal environment is one which highly discriminating the tested varieties and at the same time be representative of the target locations and desirable environments are close to the ideal environment . Accordingly, nearest to the first concentric circle, the environment Doba was the ideal environment to select widely adapted hybrid maize varieties, whereas, Mechara and Boke were far from the ideal environment and considered as unstable and it is, therefore, not a representative environment for the other three environments included in this study (Figure 2B).
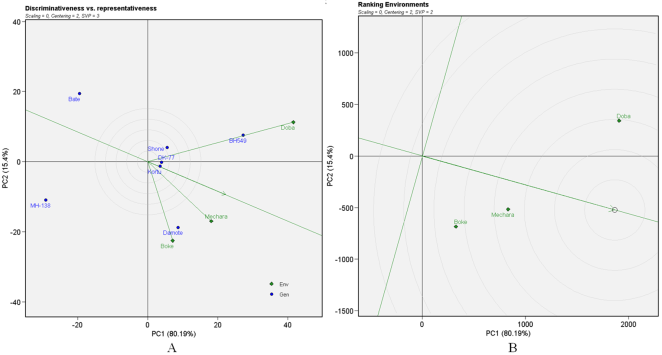
Figure 2. (A) Discriminations and representativeness to rank test environments relative to an ideal test environments (represented by center of the concentric circles), (B) Ranking of the Test Environments.
3.4.5. Evaluation of Varieties Relative to the Ideal Varieties
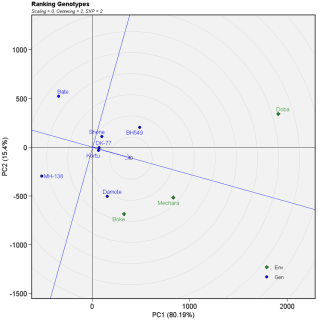
Figure 3. Biplots Ranking of genotypes relatives to the ideal genotype (the concentric circles) based on the average- environment coordinate (AEC) abscissa.
The AEC approach was used in the GGE biplot methodology to estimate genotype yield and stability . An ideal genotype is defined as one that is the highest yielding across test environments and it’s absolutely stable in performance (that ranks the highest in all test environments) . Although such an “ideal” genotype may not exist in reality, it could be used as a reference for genotype evaluation and a genotype is more desirable if it is located closer to “ideal” genotype . The varieties closer to the “ideal” were BH549, Damote and DK-77. On the contrary, the lower yielding varieties Bate and MH-138 were unfavorable because they are far from the ideal varieties (Figure 3). The relative contributions of stability and grain yield to the identification of desirable genotype found in this study by the ideal genotype procedure of the GGE biplot in agreement with the report of for maize grain yield.
4. Conclusions and Recommendations
A total of 7 hybrid maize including checks were evaluated at Mechara, Boke and Doba during the 2022-2023 growing season with the objectives of selecting widely adapted, stable, high yielder and good agronomic traits hybrid maize varieties for the study area. The combined ANOVA across the three locations depicted significant effects of genotypes, Locations, and genotypes by environments interaction (GEI) for phenological, yield and yield related parameters. The variances due to location was highly significant for days to silking, days to maturity, plant height, Ear height, Number of row per ear, ear length, hundred seed weight and grain yield, indicating the distinct and differential effects of different environmental conditions. The variances due to Varieties were highly significant for days to silking, plant height, ear height, Number of kernel per row, number of row per ear, ear length, hundred seed weight and grain yield indicated the genetic differences of the genotypes in the environments. The variance due to GEI was significant for Days to silking, Number of Kernel per ear, Hundred seed weight, Ear length and Grain Yield. The significant GEI indicated the inconsistent performance of genotypes across the test environments.
AMMI analysis revealed significant variation observed among genotypes (P<0.001), environments an GEI (P<0.001) and GEI (P<0.05). Environment captured 47.7% of the total sum of square followed by the GEI, which explained 8.6% of the total variation. However, genotype captured only 6.8%. The large sum of squares of the environment implies that the test environments were significantly different from each other in terms of the associated environmental parameters that affected the performances of the maize genotypes and caused most of the variation in grain yield in this study. This suggested that the yield potential of maize is greatly influenced by environmental factors. GGE biplot analyses also indicated that the most discriminating area was Boke and representative environment was Mechara for selecting wide adaptable for hybrid maize varieties. Besides, GGE biplot was also reduced in the three test environments into two representative sub-regions for evaluating hybrid maize for wide adaptability in study areas. The results of the present study indicated that BH549 showed better yield stability across all test environments, therefore, this variety recommended for the study areas. It can be concluded that this superior hybrid maize variety can be demonstrated and popularized, as well as being important for inclusion in further breeding programs since they may contribute favorable alleles in the synthesis of new varieties and make a great contribution to the food security of the target areas.
Abbreviations

AEC

Average - Environment Coordinate

GEI

Genotype by Environment Interaction

AMMI

Additive Main Effect and Multiplicative Interaction

IPCA

Interaction Principal Component Analysis

MET

Multi Environment Trials

Acknowledgments
We would like to thank the Oromia Agricultural Research Institute for financial support. The authors also thank the Mechara Agricultural Research Center for providing the necessary support and cereal crop research team staff for the entire trial management and data collection. We wish to thank Haramaya University, Bako National Maize Research Center, Melkasa Agriculture research center, Pioneer PLC and Macobu PLC for sharing of hybrid maize varities for the tester in this research.
Author Contributions
Gabisa Bekela: Conceptualization, Data curation, Formal Analysis, Funding acquisition, Investigation, Methodology, Project administration, Resources, Software, Supervision, Validation, Visualization, Writing - original draft, Writing - review & editing
Abubeker Terbush: Conceptualization, Data curation, Funding acquisition, Investigation, Methodology, Project administration, Resources, Supervision, Writing - review & editing
Desu Assegid: Conceptualization, Data curation, Methodology, Software, Supervision, Writing - review & editing
Data Availability Statement
The data used to support the findings of this study are included within the article.
Conflicts of Interest
The authors declare no conflicts of interest.
References
[1] Abduselam, F., Z. Lagese, S. Tegene, F. T. A. Biri, and N. Siraj, 2017. Performance evaluation and adaptability of improved released maize (Zea mays L.) varieties in the midlands of the Fedis district of Eastern Hararghe Asian J. Plant Sci. Res., 7: 10-14.
[2] Ahmad SQ, Khan S, Ghaffar M, Ahmad F. 2011. Genetic diversity analysis for yield and other parameters in maize (Zea mays L.) genotypes. Asian Journal of Agricultural Sciences 3(5), 385-388.
[3] Alemu, D.; Rashid, S.; Tripp, R. Seed System Potential in Ethiopia: Constraints and Opportunities for Enhancing the Seed Sector. International Food Policy Research Institute (IFPRI), 2010. Available online:
[4] Ali, A., H. Rahman, L. Shah, K. A. Shah, and S. Rehman, 2014. Heterosis for grain yield and its attributing components in the maize variety Azam using the line × tester analysis method Acad. J. Agric. Res., 2: 225-230.
[5] Angela, P., Mateo, V., Gregorio, A., Francisco, R., Marco, L., Jose, C., & Juan, B. (2016). GEA-R (genotype x environment analysis with R for Windows) Version 4, 1. CIMMYT Research Data and Software Repository Network.
[6] Awika, J. (2011). Major cereal grains production and use around the world. In: Awika, J. M., Piironen, V., & Bean, S. (Eds.), Advances in cereal science: implications to food processing and health promotion. American Chemical Society Atlantic City, NJ, Washington DC, pp. 1-13.
[7] Bayissa, T., Mengistu, G., Gerema, G., Balcha, U., Feyisa, H., Kedir, A., Legese, Z., Asegid, D., Leta, T., & Jobe, T. (2023). Genotype × environment interaction of lowland bread wheat varieties for irrigation in different areas of Oromia. Plant-Environment Interactions, 4, 2-10.
[8] Bekele Shiferaw, Hellin, J. and Muricho, G. 2011b. Improving market access and agricultural productivity growth in Africa: what role for producer organizations and collective action institutions? Food Security, 3(4): 475-489.
[9] Choi, H., Esser, A., & Murphy, K. M. (2020). Genotype × environment interaction and stability of β-glucan content in barley in the Palouse region of eastern Washington. Crop Science, 60(5), 2500-2510.
[10] Choukan R. 2011. Genotype, environment and genotype × environment interaction effects on the performance of maize (Zea mays L.) inbred lines. Crop Breeding Journal 1: 97-103.
[11] CSA, 2022 (Central Statistical Agency Agricultural Sample Survey) of 2015 E. C. Volume I Report on Area and Production of Major Crops Private Peasant Holdings, Statistical Bulletin 59, Addis Ababa, Ethiopia.
[12] Dass, S., Jat, S. L., Chikkappa, G. K. & Parihar, C. M. (2018). Crop production management to climate change. Food Security and Climate Change, pp 251-287.
[13] Dehghani, H., Ebadi, A., & Yousefi, A. (2006). Biplot analysis of genotype by environment interaction for barley yield in Iran. Agronomy Journal, 98(2), 388-393.
[14] Derby NE, Casey FX, Knighton RE, and Steele DD (2004. Midseason nitrogen fertility management for corn based on weather and yield prediction Agronomy Journal 96(2), 494-501.
[15] Desalegn Chalchisa. 2019. Genotype by environment interaction and grain yield stability of maize (Zea mays L.) Genotypes in Ethiopia, Msc Thesis, Jimma University, Jimma, Ethiopia.
[16] Emily T. Nuss and Sherry A. Tanumihardjo. 2010. Maize: a paramount staple crop in the context of global nutrition. Comprehensive reviews in food science and food safety, 9(4): 417-436.
[17] Erenstein, O., Jaleta, M., Sonder, K., Mottaleb, K. and Prasanna, B. M. 2022. Global maize production, consumption and trade: trends and R and D implications. Food Security, 1-25.
[18] Fan, X. M., Kang, M. S., Chen, H., Zhang, Y., Tan, J. and Xu, C. 2007. Yield stability of maize hybrids evaluated in multi-environment trials in Yunnan, China. Agronomy Journal 99: 220-228.
[19] FAO. FAOSTAT. Available from:
[20] Farshadfar E, R Mohammadi, M Aghaee and Z Vaisi, 2012. GGE biplot analysis of genotype x environment interaction in wheat-barley disomic addition lines. Australian Journal of Crop Science 6, 1074-1079 pp.
[21] Gauch, H. G., & Zobel, R. W. (1996). AMMI analysis of yield trials. In M. S. Kang & H. G. Gauch, Jr. (Eds.), Genotype-by-environment interaction (pp. 85-122). CRC Press.
[22] Ghimire B., Timsina D. (2015). Analysis of yield and yield-attributing traits of maize genotypes in Chitwan, Nepal. World Journal of Agricultural Research, 3(5), 153-162.
[23] Giesbrecht, J. (1961. The inheritance of ear height in Zea mays. Can. J. Genet. Cytol. 3: 26-33.
[24] Gomez, A. K., & Gomez, A. A. (1984). Statistical procedure for agricultural research. John Wiley and Sons.
[25] Guush Berhane, Zelekawork Paulos, Kibrom Tafere, and Seneshaw Tamiru. 2011. Foodgrain consumption and calorie intake patterns in Ethiopia. IFPRI Ethiopia Strategy Support Program II (ESSP II) Working Paper, 23: 1-17.
[26] Hailegebrial Kinfe, Yiergalem T., Alem R., Redae W., and Desalegn Y. Welegerima G., Kifle G., and Husien S. (2016) Evaluating hybrid maize genotypes for grain yield and yield-related traits in north-western Tigray, Ethiopia International Journal of Research in Agriculture and Forestry, 3(12): 17-21.
[27] Heisey, P. W. and Edmeades, G. O. 1999. CIMMYT 1997/98 world maize facts and trends; maize production in drought-stressed environments: technical options and research resource allocation.
[28] Hidayat-ur-Rahman IN, Shah S, Durrishahwar I, Khalil MI, Sohail M, Khan M. 2009. Evaluation of testcrosses derived from maize variety Azam for yield and yield associated traits. Sarhad Journal of Agriculture, 25(2), 197-201.
[29] Hongyu K., Silva F. L., Oliveira A. C. S., Sarti D. A., Araújo L. C., Dias C. T. S. (2015): Comparação entre os modelos AMMI e GGE Biplot para os dados de ensaios multi-ambientais. Rev. Bras. Biom., São Paulo 33(2): 139-155.
[30] Jompuk, C., Cheuchart, P., Jompuk, P. and Apisitwanich, S. 2011. Improved tryptophan content in maize with opaque-2 gene using marker assisted selection (MAS) in backcross and selfing generations. Agriculture and Natural Resources, 45(4): 66- 674.
[31] Kennett, D. J., Prufer, K. M., Culleton, B. J., George, R. J., Robinson, M., Trask, W. R., Buckley, G. M., Moes, E., Kate, E. J., Harper, T. K., O’Donnell, L., Ray, E. E., Hill, E. C., Alsgaard, A., Merriman, C., Meredith, C., Edgar, H. J. H., Awe, J. J., & Gutierrez, S. M. (2020). Early isotopic evidence for maize as a staple grain in the Americas. Science Advances, 6, eaba3245.
[32] Khan S., Awan IU, Baloch MS. 2013. Performance of Maize Varieties Under Irrigated Conditions by Dera Ismail Khan Gomal University Journal of Research, 29(2).
[33] Legese Wolde., Tolera Keno, Abenezer Abebe, Demisew Abakemal, Workinesh Terefe. and Demoz Negera. 2020. Genotype x environment interaction and stability analysis of grain yield in QPM hybrid varieties. Maydica, 64(3): 1-10.
[34] Lutz, W., Sanderson, W. and Scherbov, S. 2001. The end of world population growth. Nature, 412(6846): 543-54.
[35] Mitrovic B, Stanisavljevi D, Treski S, Stojakovic M, Ivanovic M, Bekavac G & Rajkovic. M. 2012. Evaluation of experimental Maize hybrids tested in Multi-location trials using AMMI and GGE biplot analysis. Turkish Journal of Field Crops: 17(1): 35-40.
[36] Mohammed Abate. 2020. Genotype by environment interaction and yield stability analysis of open pollinated maize varieties using AMMI model in Afar Regional State, Ethiopia. Journal of Plant breeding and crop science, 12(1): 8-15.
[37] Muhammad N, Muhammad I, Shah S. 2010. Evaluation of maize half sib families for maturity and grain yield attributes. Sarhad Journal of Agriculture, 26(4), 545-549.
[38] Murdia, L. K., Wadhwani, R., Wadhawan, N., Bajpai, P. & Shekhawat, S. (2016). Maize utilization in India: an overview. American Journal of Food and Nutrition, 4(6): 169-176.
[39] Nigatu G and Hansen J, Low growth in corn yields has dragged down Sub-Saharan African. Amber Waves-USDA Economic Research Service (2019).
[40] Olakojo S, Olaoye G. 2005. Combining ability for grain yield, agronomic traits and Striga lutea tolerance of maize hybrids under artificial striga infestation. African Journal of Biotechnology, 4(9).
[41] Orhun, G. E. 2013. Maize for life. International Journal of Food Science and Nutrition Engineering, 3(2): 13-16.
[42] Pingali, P. and Pandey, S. 2001. Meeting world maize needs: technological opportunities and priorities for the public sector.
[43] Qamar M, Gurmani ZA, Malik HN, Tanveer SK, Qamar M, Gurmani Z, Malik H, Tanveer S. 2007. Evaluation of maize hybrids/synthetics under double cropping zone of northern areas of Pakistan. Sarhad Journal of Agriculture 23(4), 1009.
[44] Ranum, P., Peña‐Rosas, J. P. and Garcia‐Casal, M. N. 2014. Global maize production, utilization, and consumption. Annals of the new York academy of sciences, 1312(1): 105-112.
[45] Reeves, T., Pinstrup‐Andersen, P. and Pandya‐Lorch, R. 1999. Food security and the role of agricultural research. Genetics and Exploitation of Heterosis in Crops, 1-5.
[46] Ruswandi, D., Syafii, M., Maulana, H., Ariyanti, M., Indriani, N. P., & Yuwariah, Y. (2021). GGE Biplot Analysis for Stability and Adaptability of Maize Hybrids in Western Region of Indonesia. International Journal of Agronomy, 2021.
[47] Salami A, Adegoke S, Adegbite O. 2007. Genetic variability among maize cultivars grown in EkitiState, Nigeria. Middle-East Journal Science Research 2(1), 09-13.
[48] Shafiullah RJ, Basir A, Alam JE, Ali A, Khan GR, Aziz A, Anjum MM, Khan I. 2018.25. Evaluation of eight maize genotypes for yield and yield-contributing traits Pure and Applied Biology (PAB), 7(2), 620-624.
[49] Thakur, P., Kumar, P., Shukla, A. K., Butail, N. P., Sharma, M., Kumar, P. & Sharma, U. (2023). Quantitative, qualitative, and energy assessment of boron fertilization on maize production in north-west Himalayan region. International Journal of Plant Production, 17(1): 165-176.
[50] Tolera Keno, Gerum Azmach, Dagne wegary Gissa, Mosisa Regasa, Berhanu Tadesse, Legesse Wolde, Temesgen Deressa, Beyene Abebe, Temesegen Chibsa and Mahabaleswara, S. 2018. Major biotic maize production stresses in Ethiopia and their management through host resistance.
[51] Troyer A, Larkins J. 1985. Selection for early flowering in corn: 10 late synthetics. Crop Science, 25(4), 695-697.
[52] Tsedeke Abate, Bekele Shiferaw, Abebe Menkir, Dagne Wegary, Yilma Kebede, Kindie Tesfaye, Menale Kassie, Gezahegn Bogale, Berhanu Tadesse and Tolera Keno. 2015. Factors that transformed maize productivity in Ethiopia. Food security, 7: 965-981.
[53] Ullah I, Khan SA, Ali A, Khan KM, Ali N, Khan A, Ali A, Khan I, and Raza H. (2016) Evaluation of maize genotypes for some quantitative traits in the agro-climatic conditions of Swat Valley International Journal of Biosciences, 8, 77-81.
[54] United State Department of Agriculture (USDA). World Agricultural Production. Foreign Agricultural Service/USDA 2-22 February. Circular Series WAP. 2022: 2-22.
[55] Yan W, Kang MS, 2003. GGE biplot analysis: a graphical tool for breeders, geneticists, and agronomists CRC Press, Boca Raton, FL.
[56] Yan W, MS Kang, MAS Woods, and PL Cornelius. 2007. GGE Bi-plot Vs. AMMI Analysis of Genotype-by environment data. Crop Sci., 47: 643-655.
[57] Yan, W. (2011). GGE Biplot vs AMMI Graphs for Genotype-byEnvironment Data Analysis. Journal of Indian Society Agricultural Statistics, 65(2), 181-193.
[58] Yan, W., and Tinker, N. A., 2006. Biplot analysis of multi-environment trial data: principles and applications Canadian Journal of Plant Science, 86(3): 623-645.
[59] Yan, W., Cornelius, P. L., Crossa, J., & Hunt, L. A. (2001). Two types of GGE biplots for analyzing multi-environment trial data. Crop Science, 41, 656-663.
[60] Zulfiqar A, Haqqani A, Ashiq S, and Allah B. 2006. Growth and yield components of maize cultivars in Khushab District Pakistan Journal of Agricultural Research, 19(4), 55-58.
Cite This Article
  • APA Style

    Bekela, G., Terbush, A., Assegid, D. (2025). Evaluation and Selection of Recently Released Hybrid Maize Varieties for Their Adaptability in West Hararghe Zone, Eastern Ethiopia. Journal of Plant Sciences, 13(5), 180-192. https://doi.org/10.11648/j.jps.20251305.11

    Copy | Download

    ACS Style

    Bekela, G.; Terbush, A.; Assegid, D. Evaluation and Selection of Recently Released Hybrid Maize Varieties for Their Adaptability in West Hararghe Zone, Eastern Ethiopia. J. Plant Sci. 2025, 13(5), 180-192. doi: 10.11648/j.jps.20251305.11

    Copy | Download

    AMA Style

    Bekela G, Terbush A, Assegid D. Evaluation and Selection of Recently Released Hybrid Maize Varieties for Their Adaptability in West Hararghe Zone, Eastern Ethiopia. J Plant Sci. 2025;13(5):180-192. doi: 10.11648/j.jps.20251305.11

    Copy | Download

  • @article{10.11648/j.jps.20251305.11,
      author = {Gabisa Bekela and Abubeker Terbush and Desu Assegid},
      title = {Evaluation and Selection of Recently Released Hybrid Maize Varieties for Their Adaptability in West Hararghe Zone, Eastern Ethiopia
    },
      journal = {Journal of Plant Sciences},
      volume = {13},
      number = {5},
      pages = {180-192},
      doi = {10.11648/j.jps.20251305.11},
      url = {https://doi.org/10.11648/j.jps.20251305.11},
      eprint = {https://article.sciencepublishinggroup.com/pdf/10.11648.j.jps.20251305.11},
      abstract = {Maize is the most frequently widely grown crop in the world; one of the major constraints affecting maize production and productivity is the inadequacy of widely adapted, high-yielding, disease- and insect-resistant varieties. The objective of this study was to select widely adapted, stable, high yielder and good agronomic traits hybrid maize varieties for the study area.. The study was conducted at Mechara, Boke, and Doba locations for two years, during 2022-2023 main cropping seasons. Seven-hybrid maize Varieties were examined in six environments under rain-fed conditions using the RCB Design with three replications. Analysis of variance revealed highly significant (p ≤ 0.001) variance due to varieties, environments, and GEI among all traits. days to silking, days to maturity, plant height, Ear height, Number of row per ear, ear length, hundred seed weight and grain yield were highly affected by environment, and varieties, while Days to silking, Number of Kernel per ear, hundred seed weight, Ear length and Grain Yield were mainly affected by GEI variations. AMMI analysis indicated significant genotype, environment and GEI effects; accounting for 6.8%, 47.7% and 8.6%, respectively, to the total variation. IPCA1 and IPCA2 accounted for 84.3% (63.2% and 21.1%) of the G + GE variation for grain yield of the varieties evaluated at six environments. Among testing sites, Three Varieties (BH549, Damote and DK-77) were superior and stable across test environments for grain yield and related traits. Overall, based on mean grain yield, AMMI and GGE biplot, BH549 was the most stable and high-yielding hybrid maize variety.. It can be concluded that this superior hybrid maize variety can be demonstrated and popularized, as well as being important for inclusion in further breeding programs since they may contribute favorable alleles in the synthesis of new varieties and make a great contribution to the food security of the target areas.
    },
     year = {2025}
    }
    

    Copy | Download

  • TY  - JOUR
    T1  - Evaluation and Selection of Recently Released Hybrid Maize Varieties for Their Adaptability in West Hararghe Zone, Eastern Ethiopia
    
    AU  - Gabisa Bekela
    AU  - Abubeker Terbush
    AU  - Desu Assegid
    Y1  - 2025/09/08
    PY  - 2025
    N1  - https://doi.org/10.11648/j.jps.20251305.11
    DO  - 10.11648/j.jps.20251305.11
    T2  - Journal of Plant Sciences
    JF  - Journal of Plant Sciences
    JO  - Journal of Plant Sciences
    SP  - 180
    EP  - 192
    PB  - Science Publishing Group
    SN  - 2331-0731
    UR  - https://doi.org/10.11648/j.jps.20251305.11
    AB  - Maize is the most frequently widely grown crop in the world; one of the major constraints affecting maize production and productivity is the inadequacy of widely adapted, high-yielding, disease- and insect-resistant varieties. The objective of this study was to select widely adapted, stable, high yielder and good agronomic traits hybrid maize varieties for the study area.. The study was conducted at Mechara, Boke, and Doba locations for two years, during 2022-2023 main cropping seasons. Seven-hybrid maize Varieties were examined in six environments under rain-fed conditions using the RCB Design with three replications. Analysis of variance revealed highly significant (p ≤ 0.001) variance due to varieties, environments, and GEI among all traits. days to silking, days to maturity, plant height, Ear height, Number of row per ear, ear length, hundred seed weight and grain yield were highly affected by environment, and varieties, while Days to silking, Number of Kernel per ear, hundred seed weight, Ear length and Grain Yield were mainly affected by GEI variations. AMMI analysis indicated significant genotype, environment and GEI effects; accounting for 6.8%, 47.7% and 8.6%, respectively, to the total variation. IPCA1 and IPCA2 accounted for 84.3% (63.2% and 21.1%) of the G + GE variation for grain yield of the varieties evaluated at six environments. Among testing sites, Three Varieties (BH549, Damote and DK-77) were superior and stable across test environments for grain yield and related traits. Overall, based on mean grain yield, AMMI and GGE biplot, BH549 was the most stable and high-yielding hybrid maize variety.. It can be concluded that this superior hybrid maize variety can be demonstrated and popularized, as well as being important for inclusion in further breeding programs since they may contribute favorable alleles in the synthesis of new varieties and make a great contribution to the food security of the target areas.
    
    VL  - 13
    IS  - 5
    ER  - 

    Copy | Download

Author Information
  • Mechara Agricultural Research Center, Mechara, Ethiopia

    Biography: Gabisa Bekela is a Researcher and Crop breeder at Mechara Agricultural Research Center, Oromia Agricultural Research Institute, Cereal Crop Research Team. He completed his Bachelor of science in plant science from Bule Hora University in 2020, and Master of Science in plant breeding from the same institution in 2023. He has participated in multiple National and regional research collaboration projects in recent years. He currently serves as crop breeder, researcher, cereal crop team team leader and Focal person of GIZ-SSAP project at Mechara agricultural research center.

    Research Fields: Crop breeder and researcher

  • Mechara Agricultural Research Center, Mechara, Ethiopia

    Biography: Abubeker Terbush is a Researcher and Crop Agronomist at Mechara Agricultural Research Center, Oromia Agricultural Research Institute, Cereal Crop Research Team. He completed his Bachelor of science in plant science from Ambo University in 2016. He has participated in multiple National and regional research collaboration projects in recent years. He currently serves as crop agronomist and researcher at Mechara agricultural research center.

    Research Fields: Crop agronomist and researcher

  • Mechara Agricultural Research Center, Mechara, Ethiopia

    Biography: Desu Assegid is a Researcher and Crop breeder at Mechara Agricultural Research Center, Oromia Agricultural Research Institute, Cereal Crop Research Team. He completed his Bachelor of science in plant science from Mada Walabu University in 2017, and Master of Science in plant breeding from the Haramaya University in 2022. He has participated in multiple National and regional research collaboration projects in recent years. He currently serves as crop breeder and researcher at Mechara agricultural research center.

    Research Fields: Crop breeder and researcher